- Published on
Grafana Dashboard for Spring Boot via Micrometer and Prometheus
- Authors
- Name
- Mehmet Baris Kalkar
- @bariskalkar


We will be implementing a grafana dashboard with metrics from a prometheus instance, which periodically fetches data from a Spring Boot App. I will keep this implementation as minimal as I can and will create another post with more detailed use cases.
We will begin by generating a simple project on Spring Initialzr

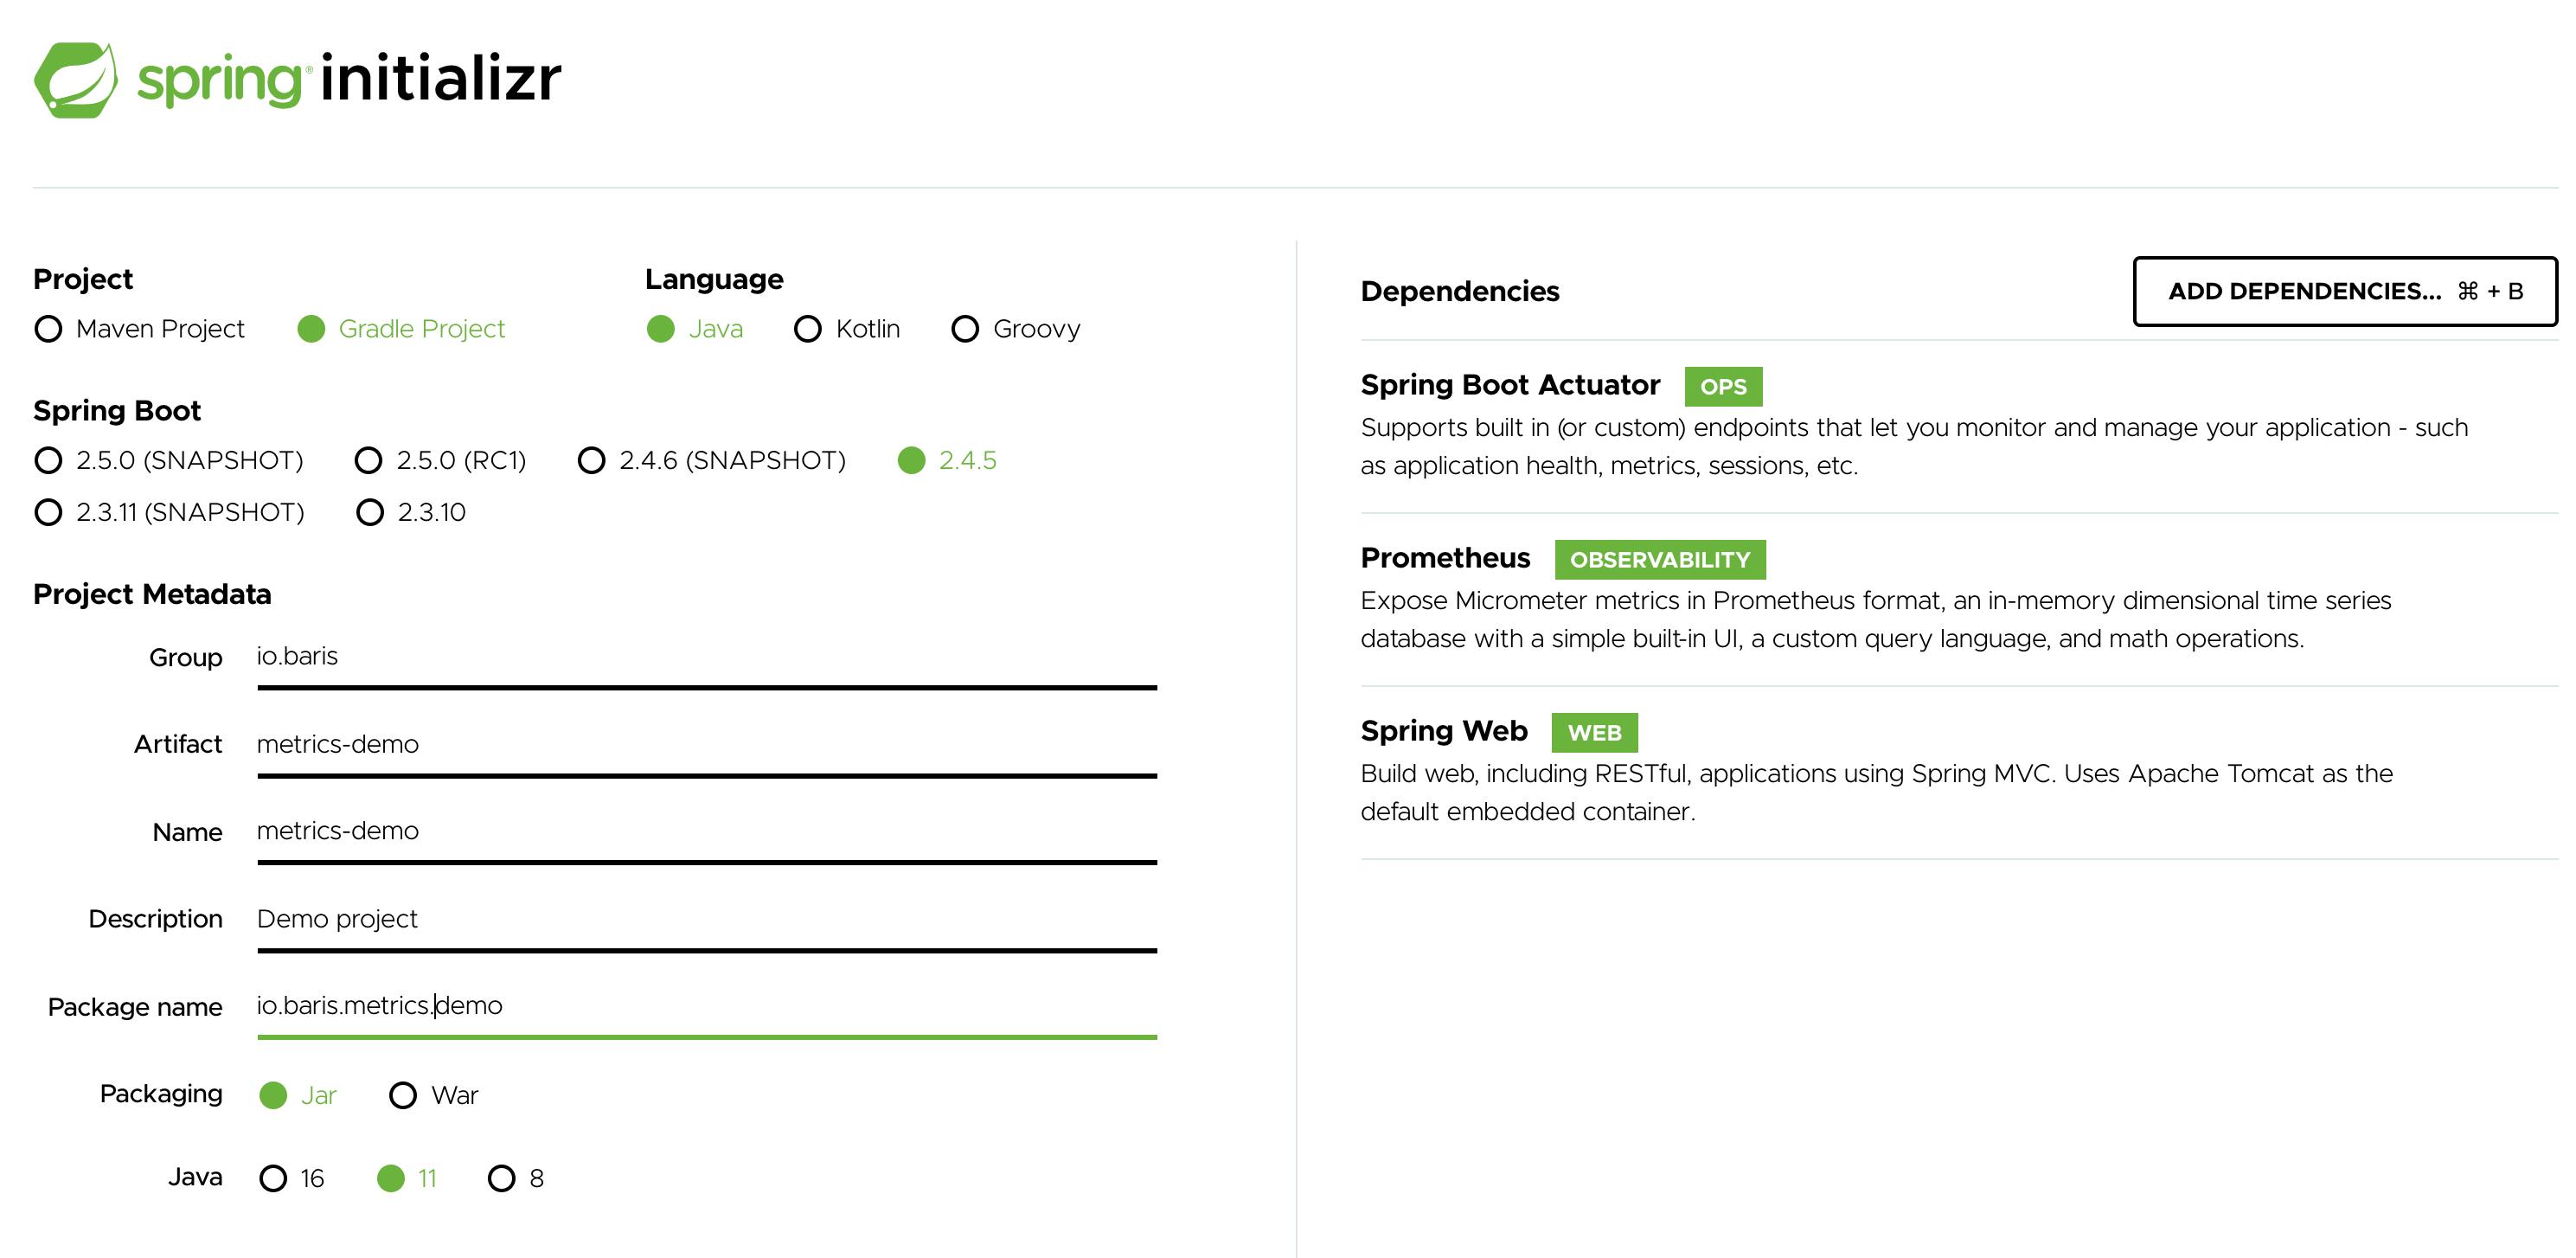
We just need the dependencies to Spring Boot Web, Spring Boot Actuator and Prometheus Registry for Micrometer. Once we import the project and run it, we will see in the logs that actuator is running for 2 endpoints already.
No active profile set, falling back to default profiles: default
Tomcat initialized with port(s): 8080 (http)
Starting service [Tomcat]
Starting Servlet engine: [Apache Tomcat/9.0.45]
Initializing Spring embedded WebApplicationContext
Root WebApplicationContext: initialization completed in 906 ms
Initializing ExecutorService 'applicationTaskExecutor'
Exposing 2 endpoint(s) beneath base path '/actuator'
Tomcat started on port(s): 8080 (http) with context path ''
Started MetricsDemoAppApplication in 1.793 seconds (JVM running for 2.086)
These two endpoints are info and health.
We can call them to verify if everything is working correctly.
curl localhost:8080/actuator/health
{
  "status": "UP"
}
Micrometer Prometheus registry exposes a lot of useful metrics, however it is not autoconfigured by default. We have to add a line in our application.yml under resources to enable its integration with actuator.
application.yml
management.endpoints.web.exposure.include=info,health,prometheus
If we restart the app after adding this line, we will see that we now have 3 endpoints configured by actuator.
Exposing 3 endpoint(s) beneath base path '/actuator'
The response from this new /prometheus endpoint is in Prometheus Exposition Format which I have talked about in my previous post.
curl localhost:8080/actuator/prometheus
# HELP jvm_threads_peak_threads The peak live thread count since the Java virtual machine started or peak was reset
# TYPE jvm_threads_peak_threads gauge
jvm_threads_peak_threads 21.0
# HELP process_files_open_files The open file descriptor count
# TYPE process_files_open_files gauge
process_files_open_files 58.0
# HELP tomcat_sessions_rejected_sessions_total
# TYPE tomcat_sessions_rejected_sessions_total counter
tomcat_sessions_rejected_sessions_total 0.0
# HELP jvm_classes_unloaded_classes_total The total number of classes unloaded since the Java virtual machine has started execution
# TYPE jvm_classes_unloaded_classes_total counter
jvm_classes_unloaded_classes_total 0.0
# HELP tomcat_sessions_created_sessions_total
# TYPE tomcat_sessions_created_sessions_total counter
tomcat_sessions_created_sessions_total 0.0
# HELP jvm_classes_loaded_classes The number of classes that are currently loaded in the Java virtual machine
# TYPE jvm_classes_loaded_classes gauge
jvm_classes_loaded_classes 7030.0
# HELP process_uptime_seconds The uptime of the Java virtual machine
# TYPE process_uptime_seconds gauge
process_uptime_seconds 155.295
# HELP jvm_threads_daemon_threads The current number of live daemon threads
# TYPE jvm_threads_daemon_threads gauge
jvm_threads_daemon_threads 17.0
# HELP system_cpu_usage The "recent cpu usage" for the whole system
# TYPE system_cpu_usage gauge
system_cpu_usage 0.0
...
This format can be ingested by prometheus directly. So what we need now is to run a prometheus and grafana instances. One of the easiest ways to achieve this is using docker-compose on development stage.
docker-compose.yml
version: '3.7'
services:
  prometheus:
    image: prom/prometheus
    volumes:
      - ./prometheus.yml:/etc/prometheus/prometheus.yml
    ports:
      - 9090:9090
  grafana:
    image: grafana/grafana
    depends_on:
      - prometheus
    ports:
      - 3000:3000
prometheus.yml
# Default settings from https://prometheus.io/docs/prometheus/latest/getting_started/
global:
scrape_interval:     15s
scrape_configs:
- job_name: 'prometheus'
  metrics_path: '/actuator/prometheus'
  scrape_interval: 5s
  static_configs:
    - targets: ['host.docker.internal:8080']
We need these two files in a folder where we will be running
docker-compose up -d
If there are no errors, we should have two running containers now.

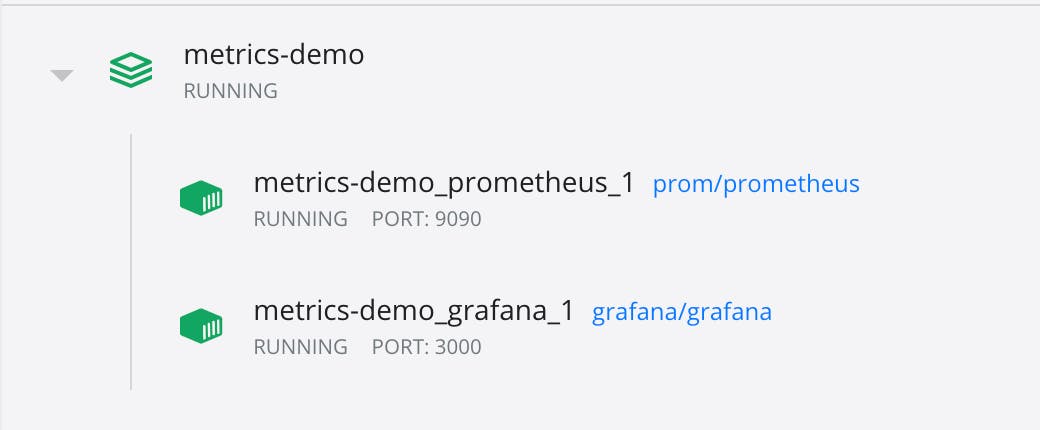
So at this point we have
- A Spring Boot app running on 8080
- Grafana on 3000
- Prometheus on 9090
On localhost:9090/targets we should see the state of our Spring Boot app as UP in

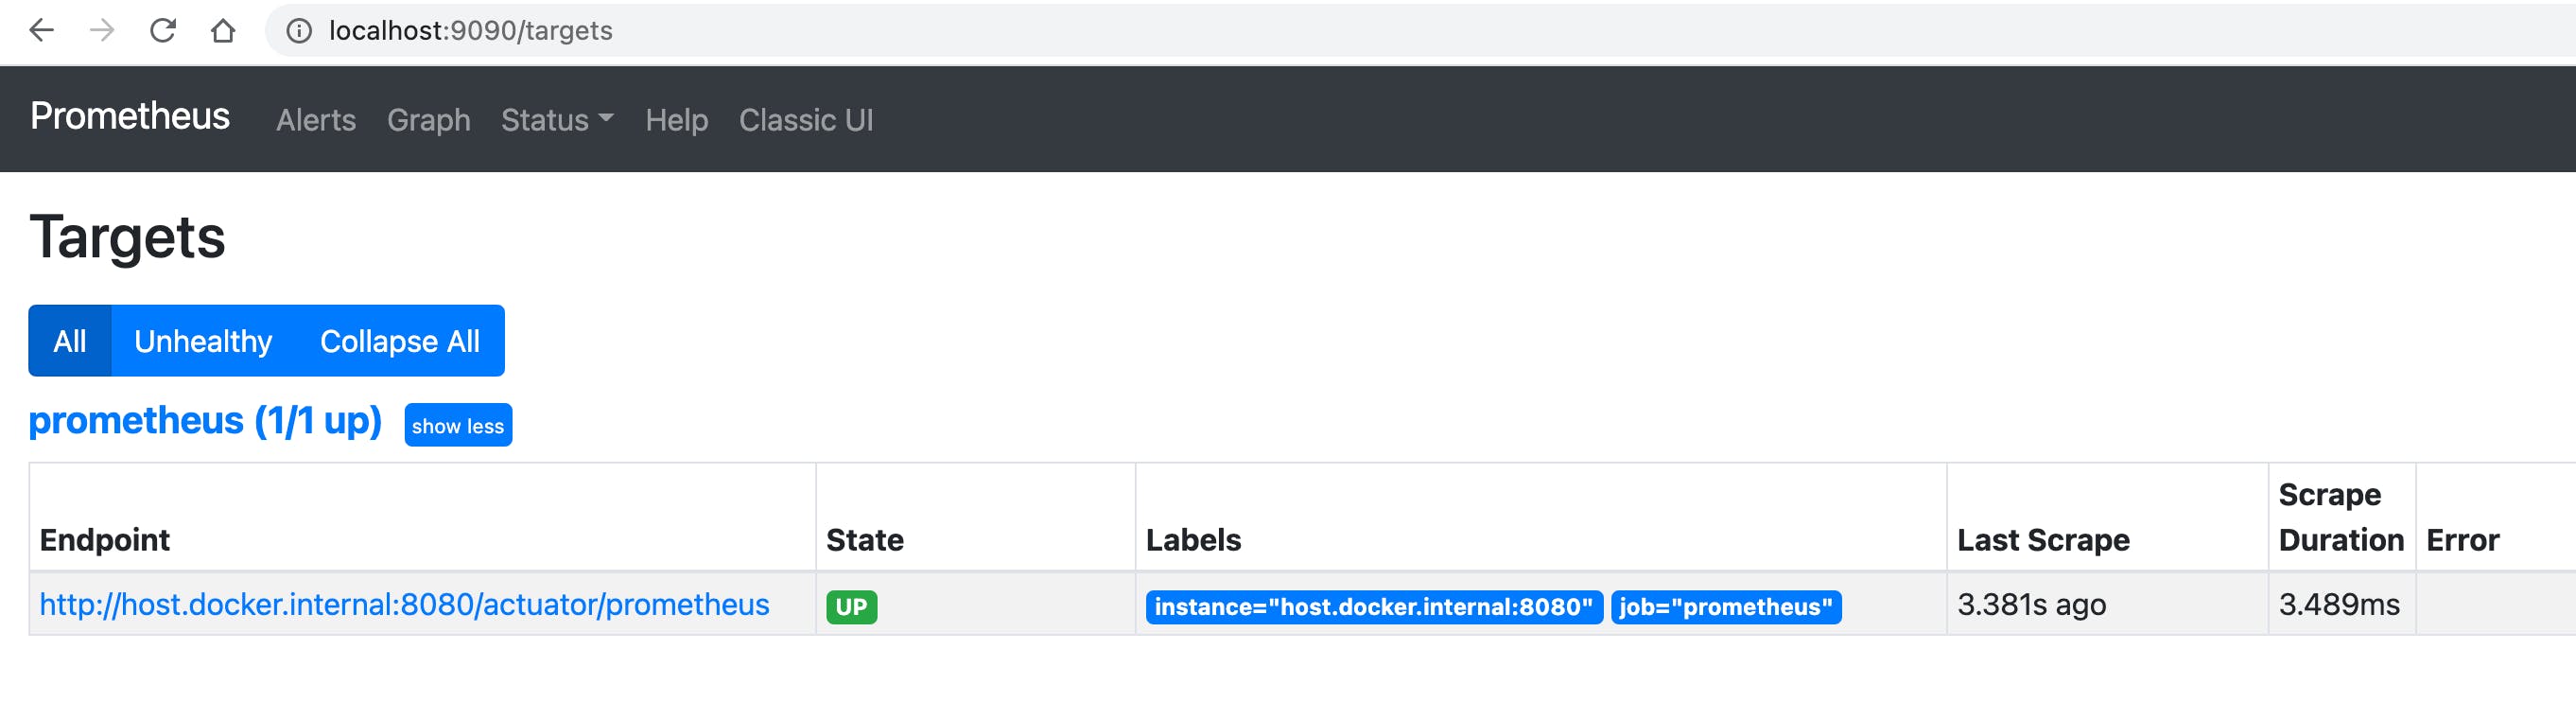
Now that we have a Prometheus instance which is collecting metrics from our app, we can start exposing this data to Grafana.
We can log in to grafana on localhost:3000 with default credentials, username:admin password:admin First thing we need to do is to add Prometheus as a data source.

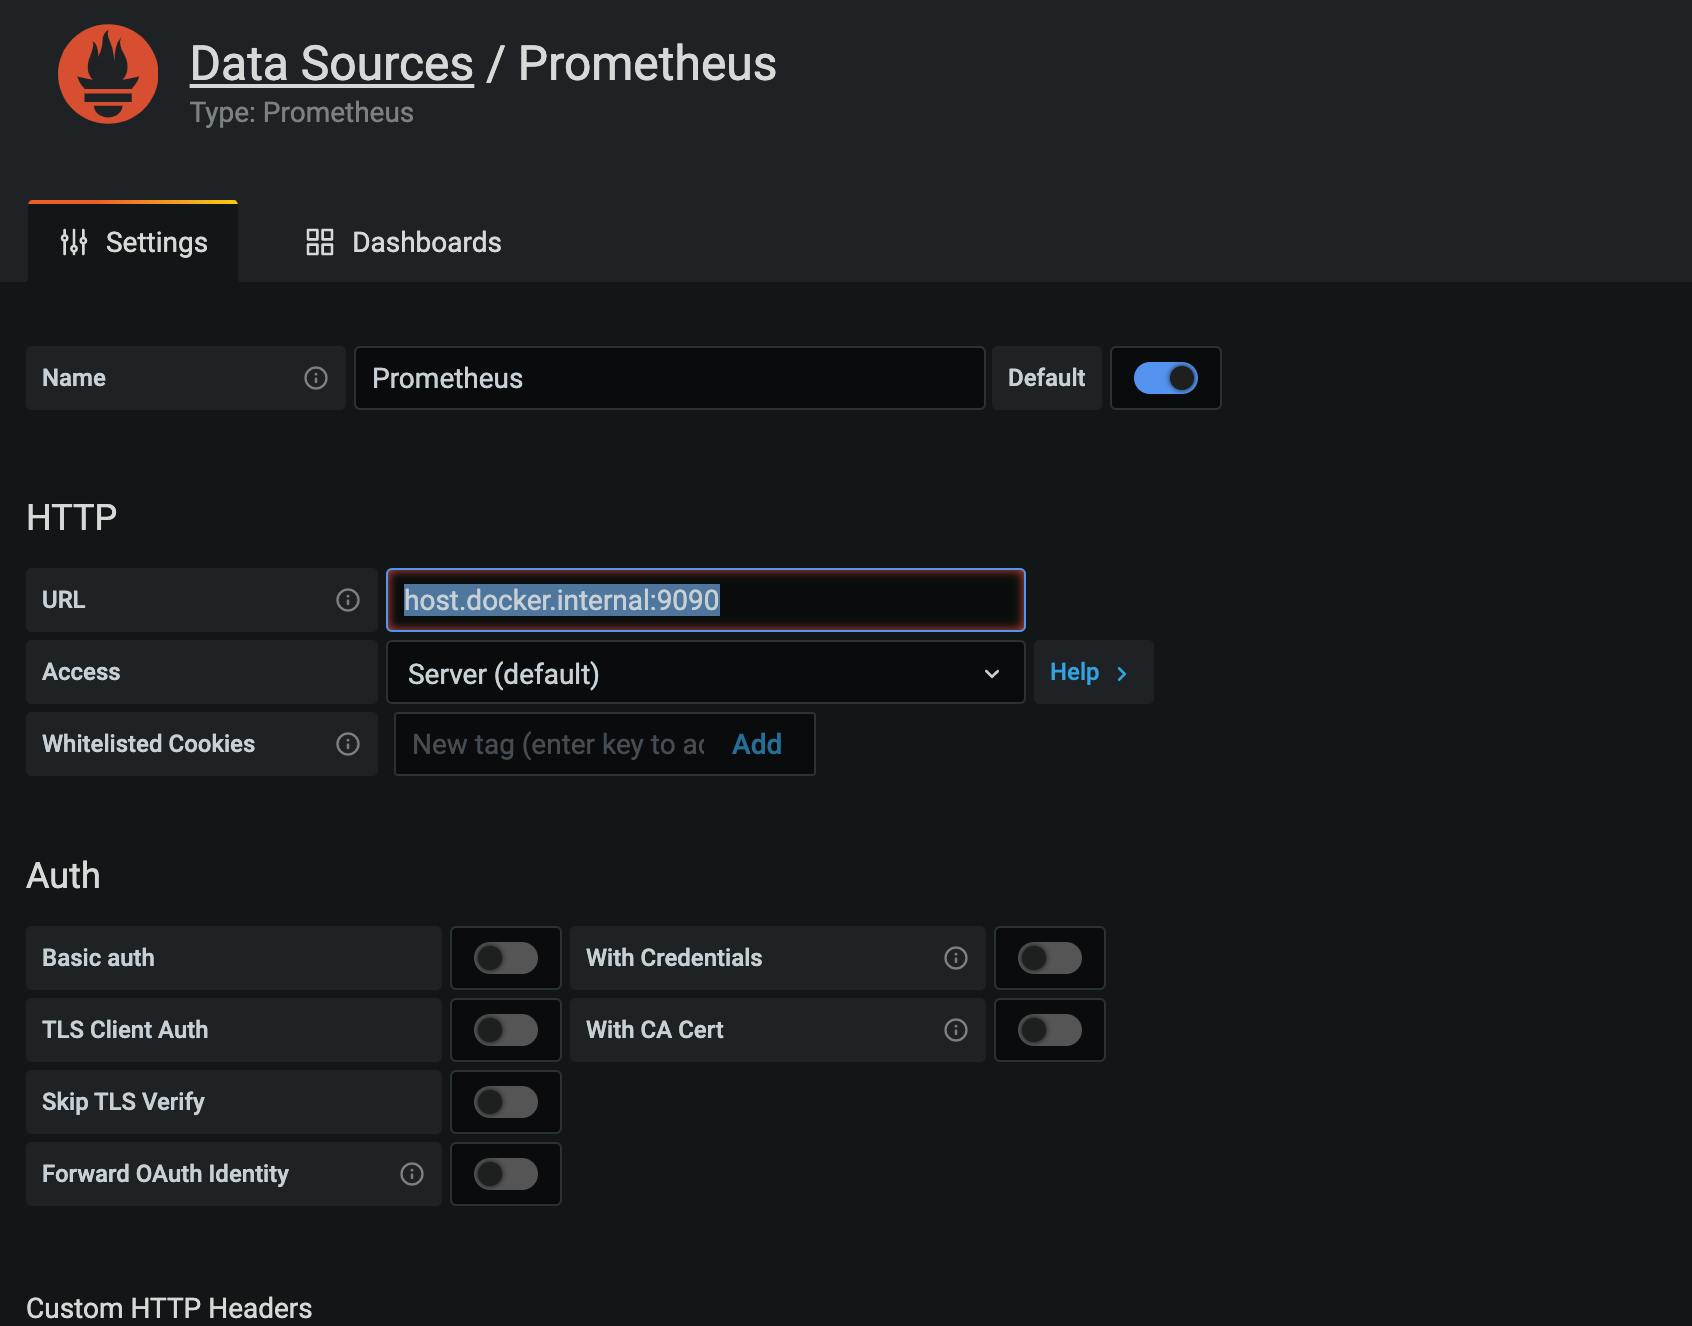
We are using host.docker.internal:9090 to target Prometheus. localhost:9090 would not work because both apps are running on containers.
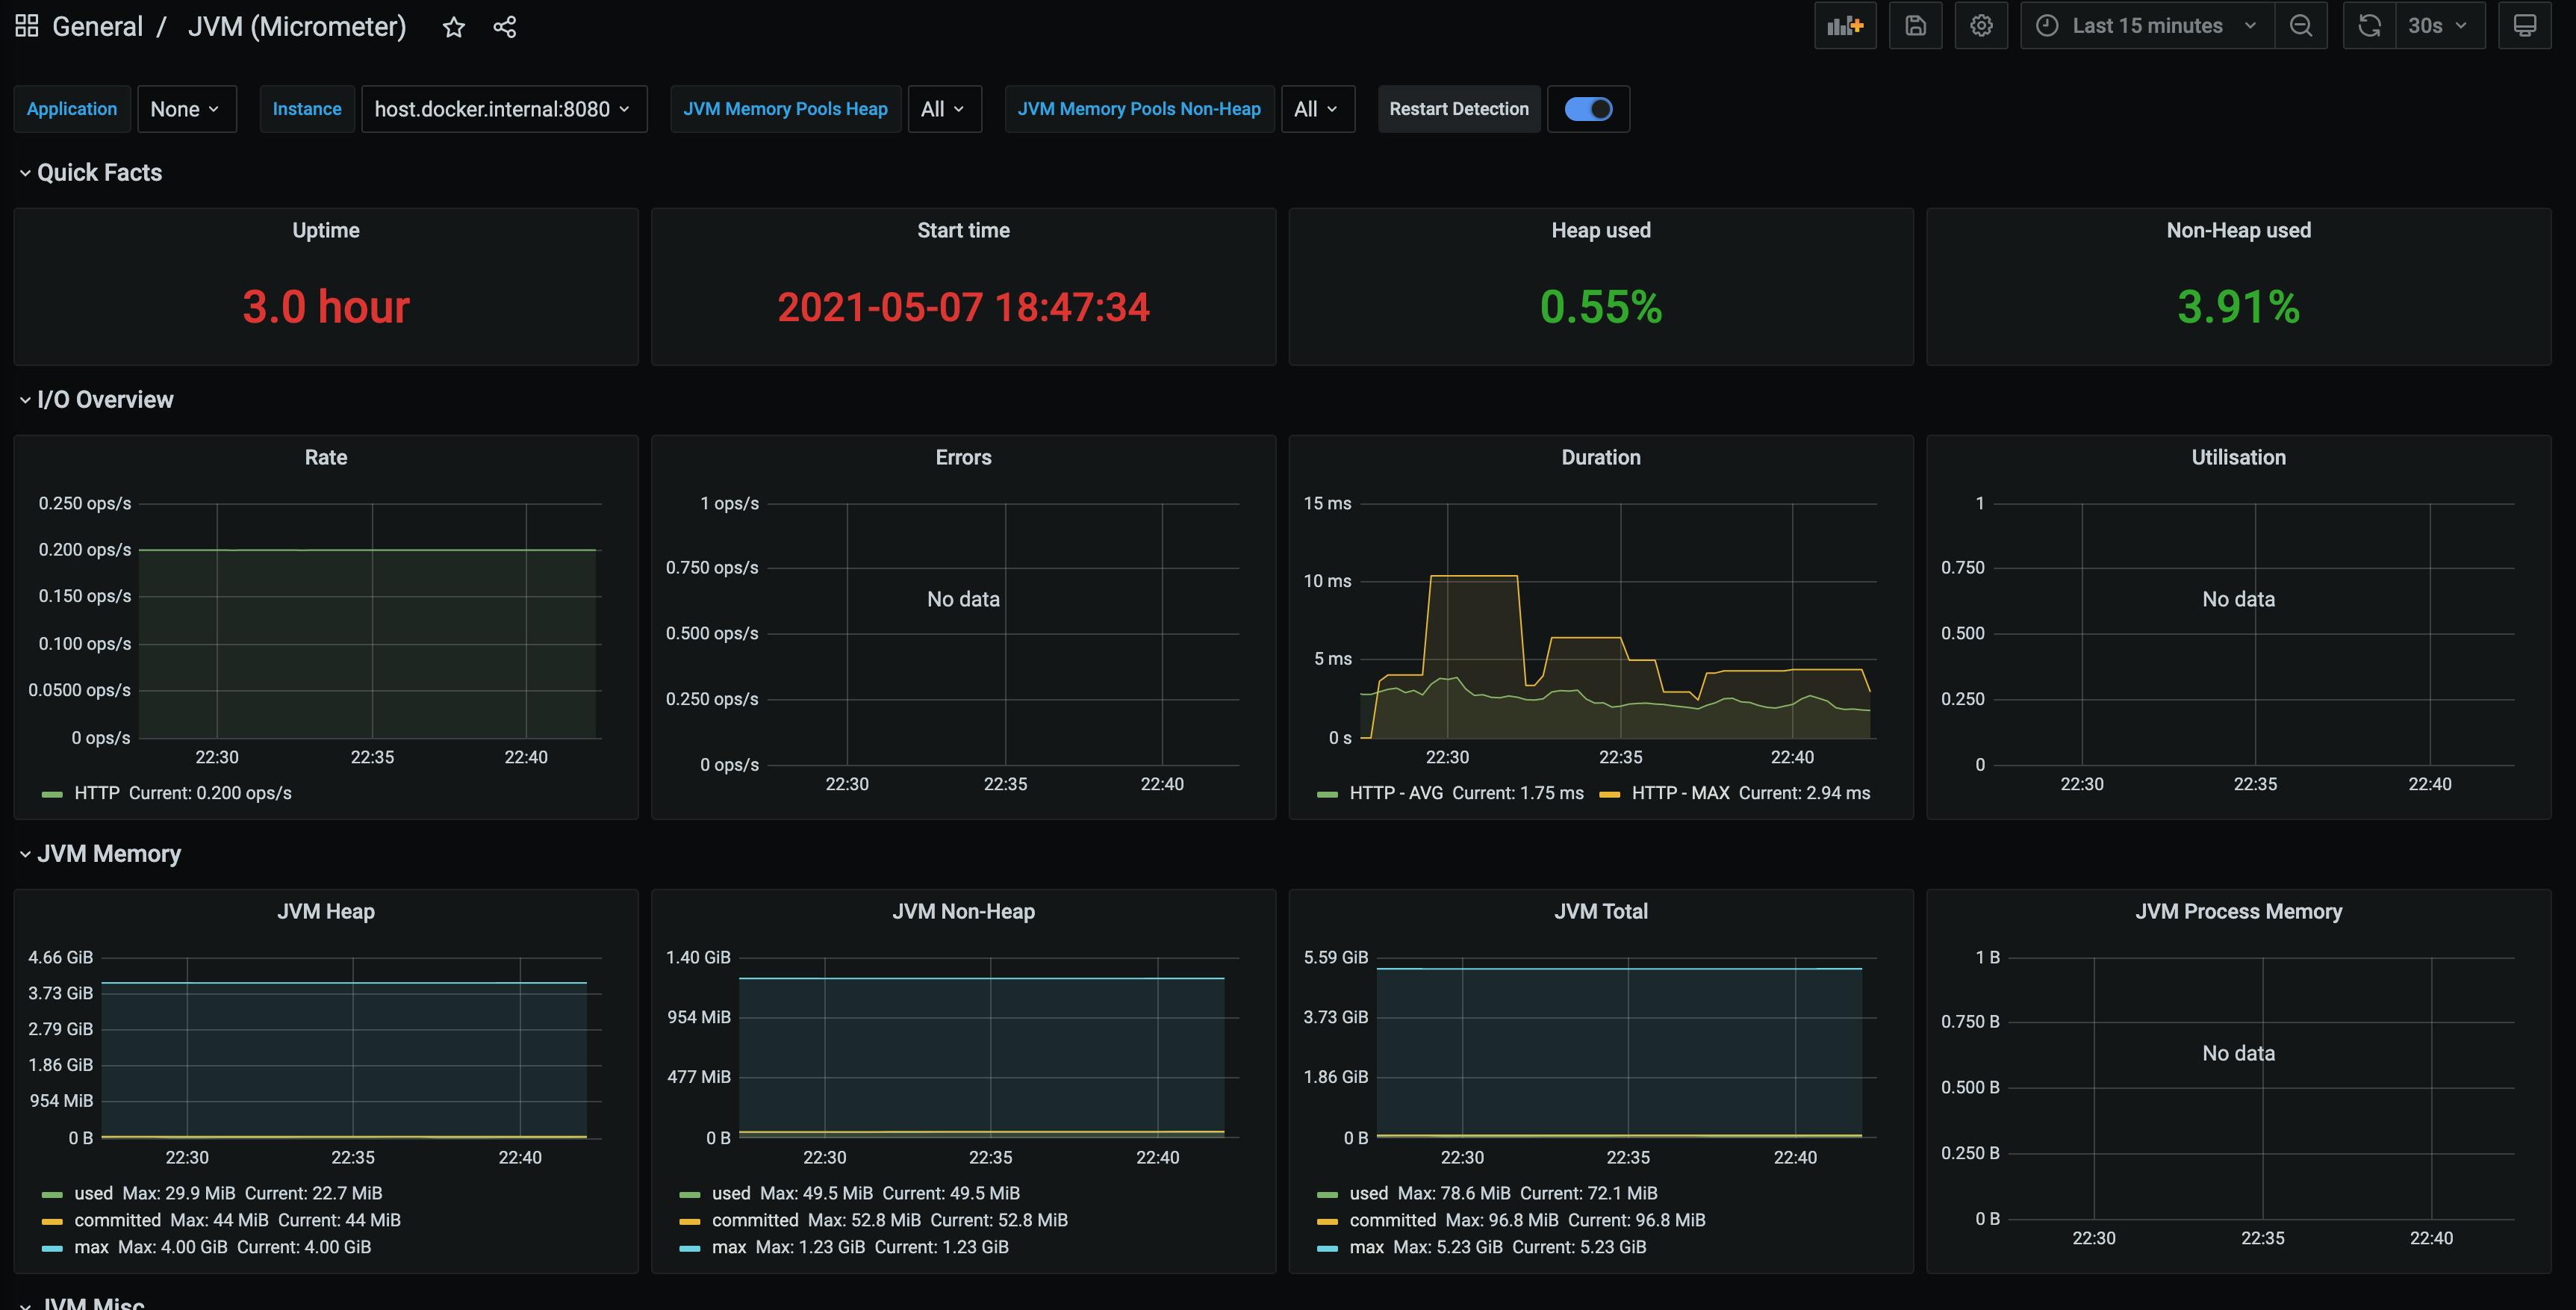
Now that we have a datasource, we can create dashboards.
While we can also create dashboards manually, micrometer has a great template we can use for tomcat + jvm metrics they publish.

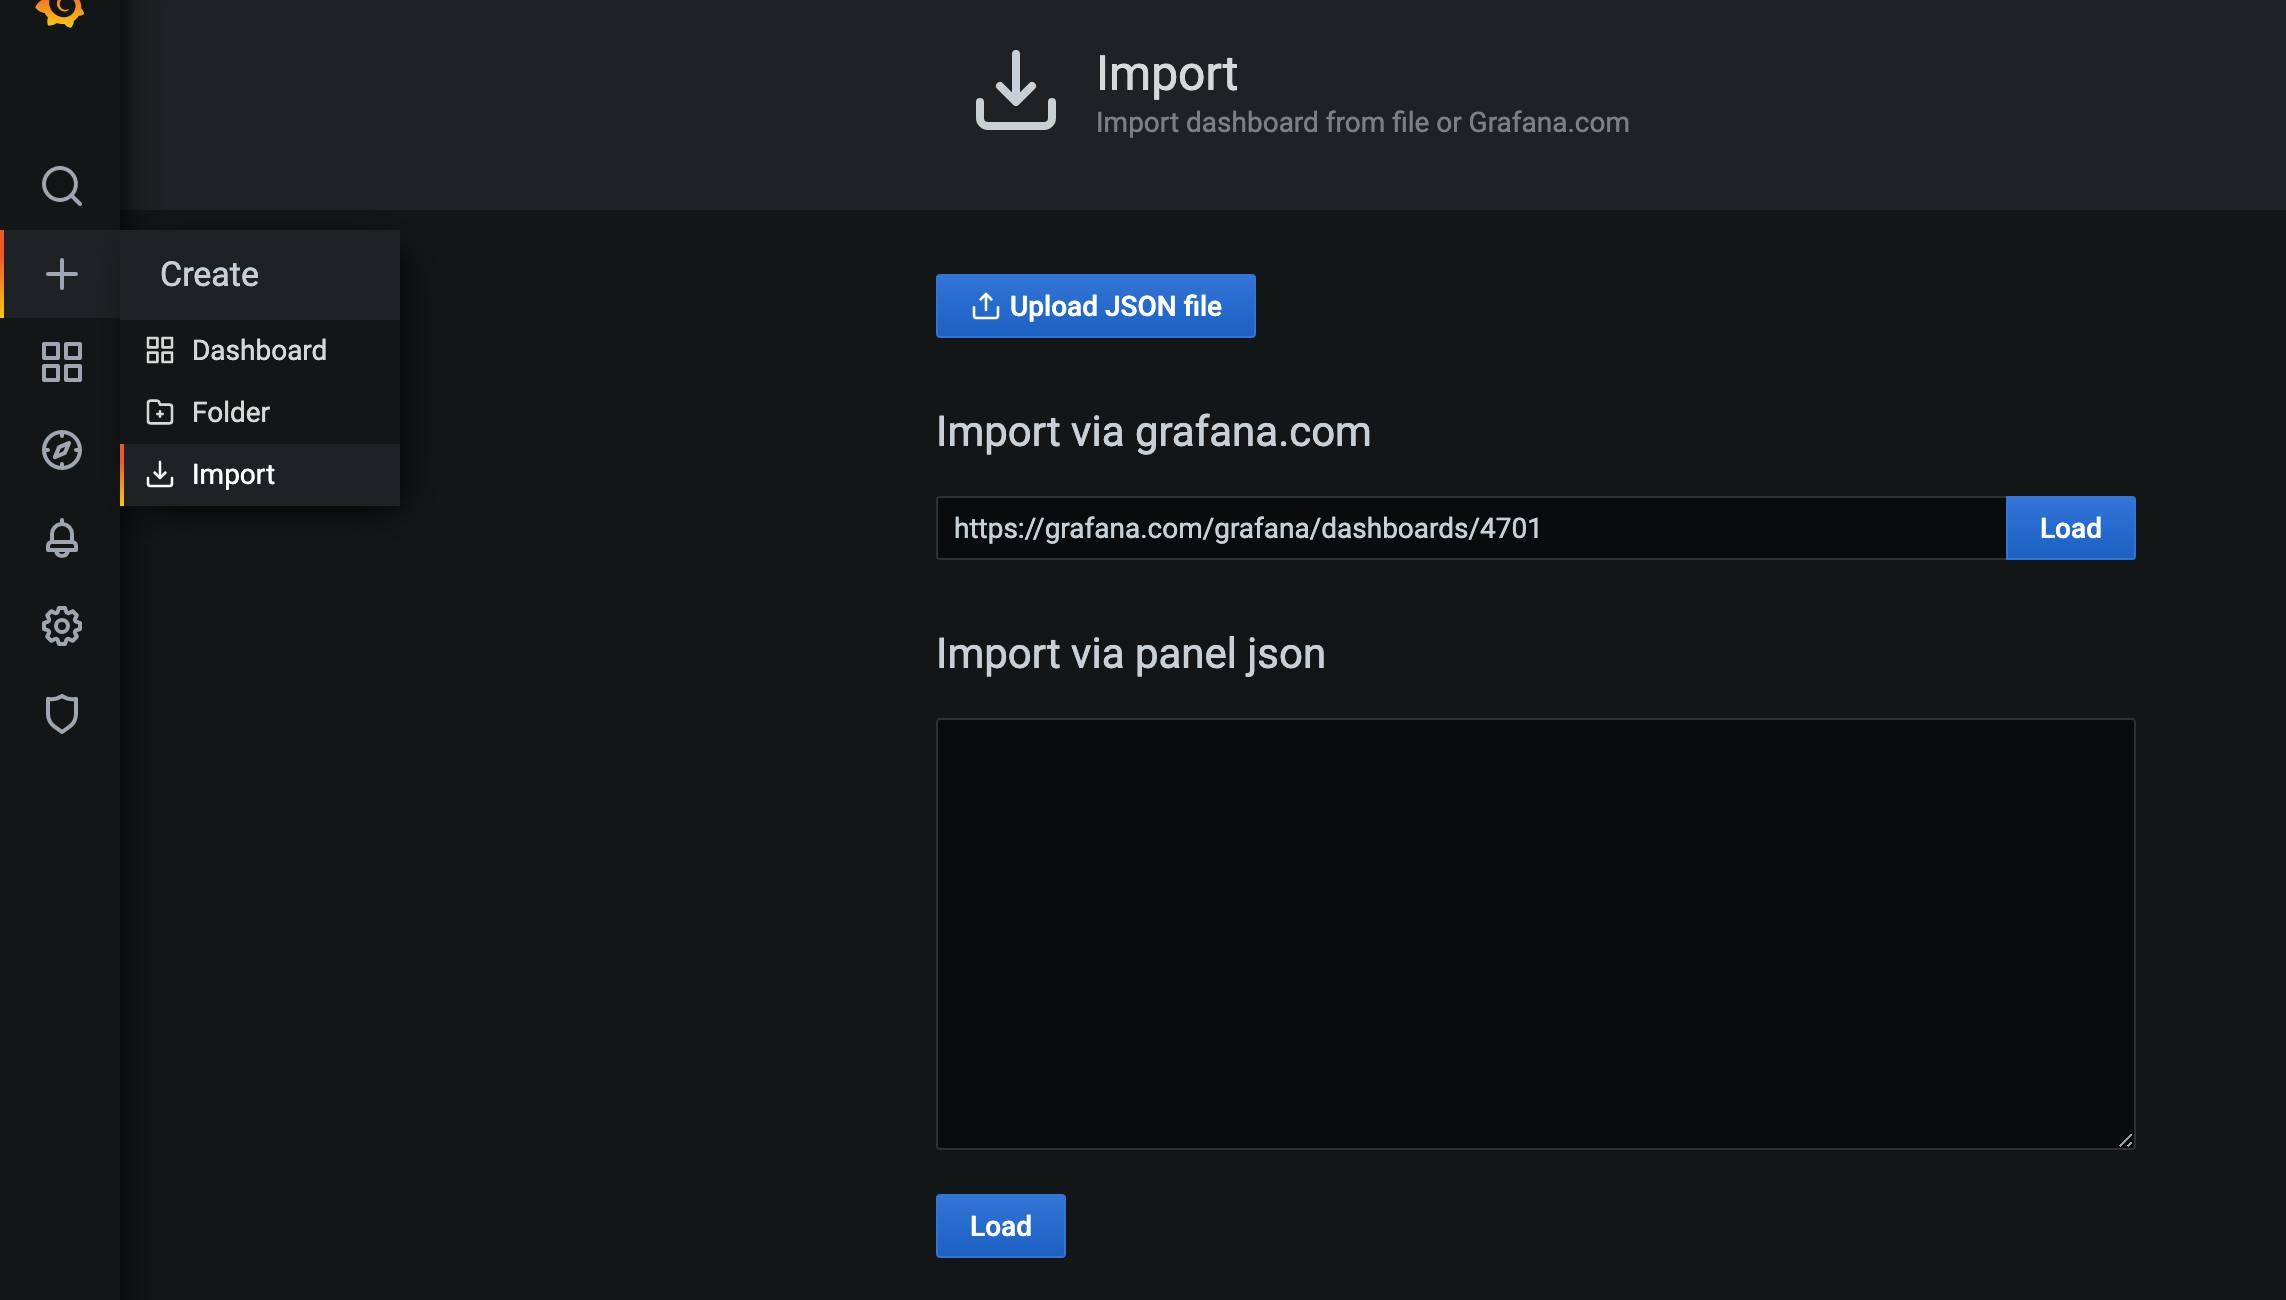
We will load "https://grafana.com/grafana/dashboards/4701" from grafana.com and choose Prometheus as our data source